The most powerful feature you're not using yet: NotebookLM's native infographic creator turns your messy documentation, research papers, or even your resume into professional visual summaries in seconds.
NotebookLM, Google's free, source-grounded AI tool for organizing knowledge and reducing hallucinations, has received a game-changing update: a native infographic creator powered by NanoBanana Pro. This isn't just another AI visualization tool—it is genuinely useful for turning complex technical sources into visual summaries that accelerate team comprehension and documentation workflows.
The integration of NanoBanana Pro's visualization suite directly into NotebookLM means you can now transform dense technical documentation, research papers, or architectural decisions into production-ready infographics without leaving your research environment. The output quality often equals or surpasses dedicated visualization platforms.
This post focuses on the infographic creator as the standout feature, with Deep Research, slide decks, and conversational customization as supporting capabilities that make NotebookLM an essential tool for technical communicators.
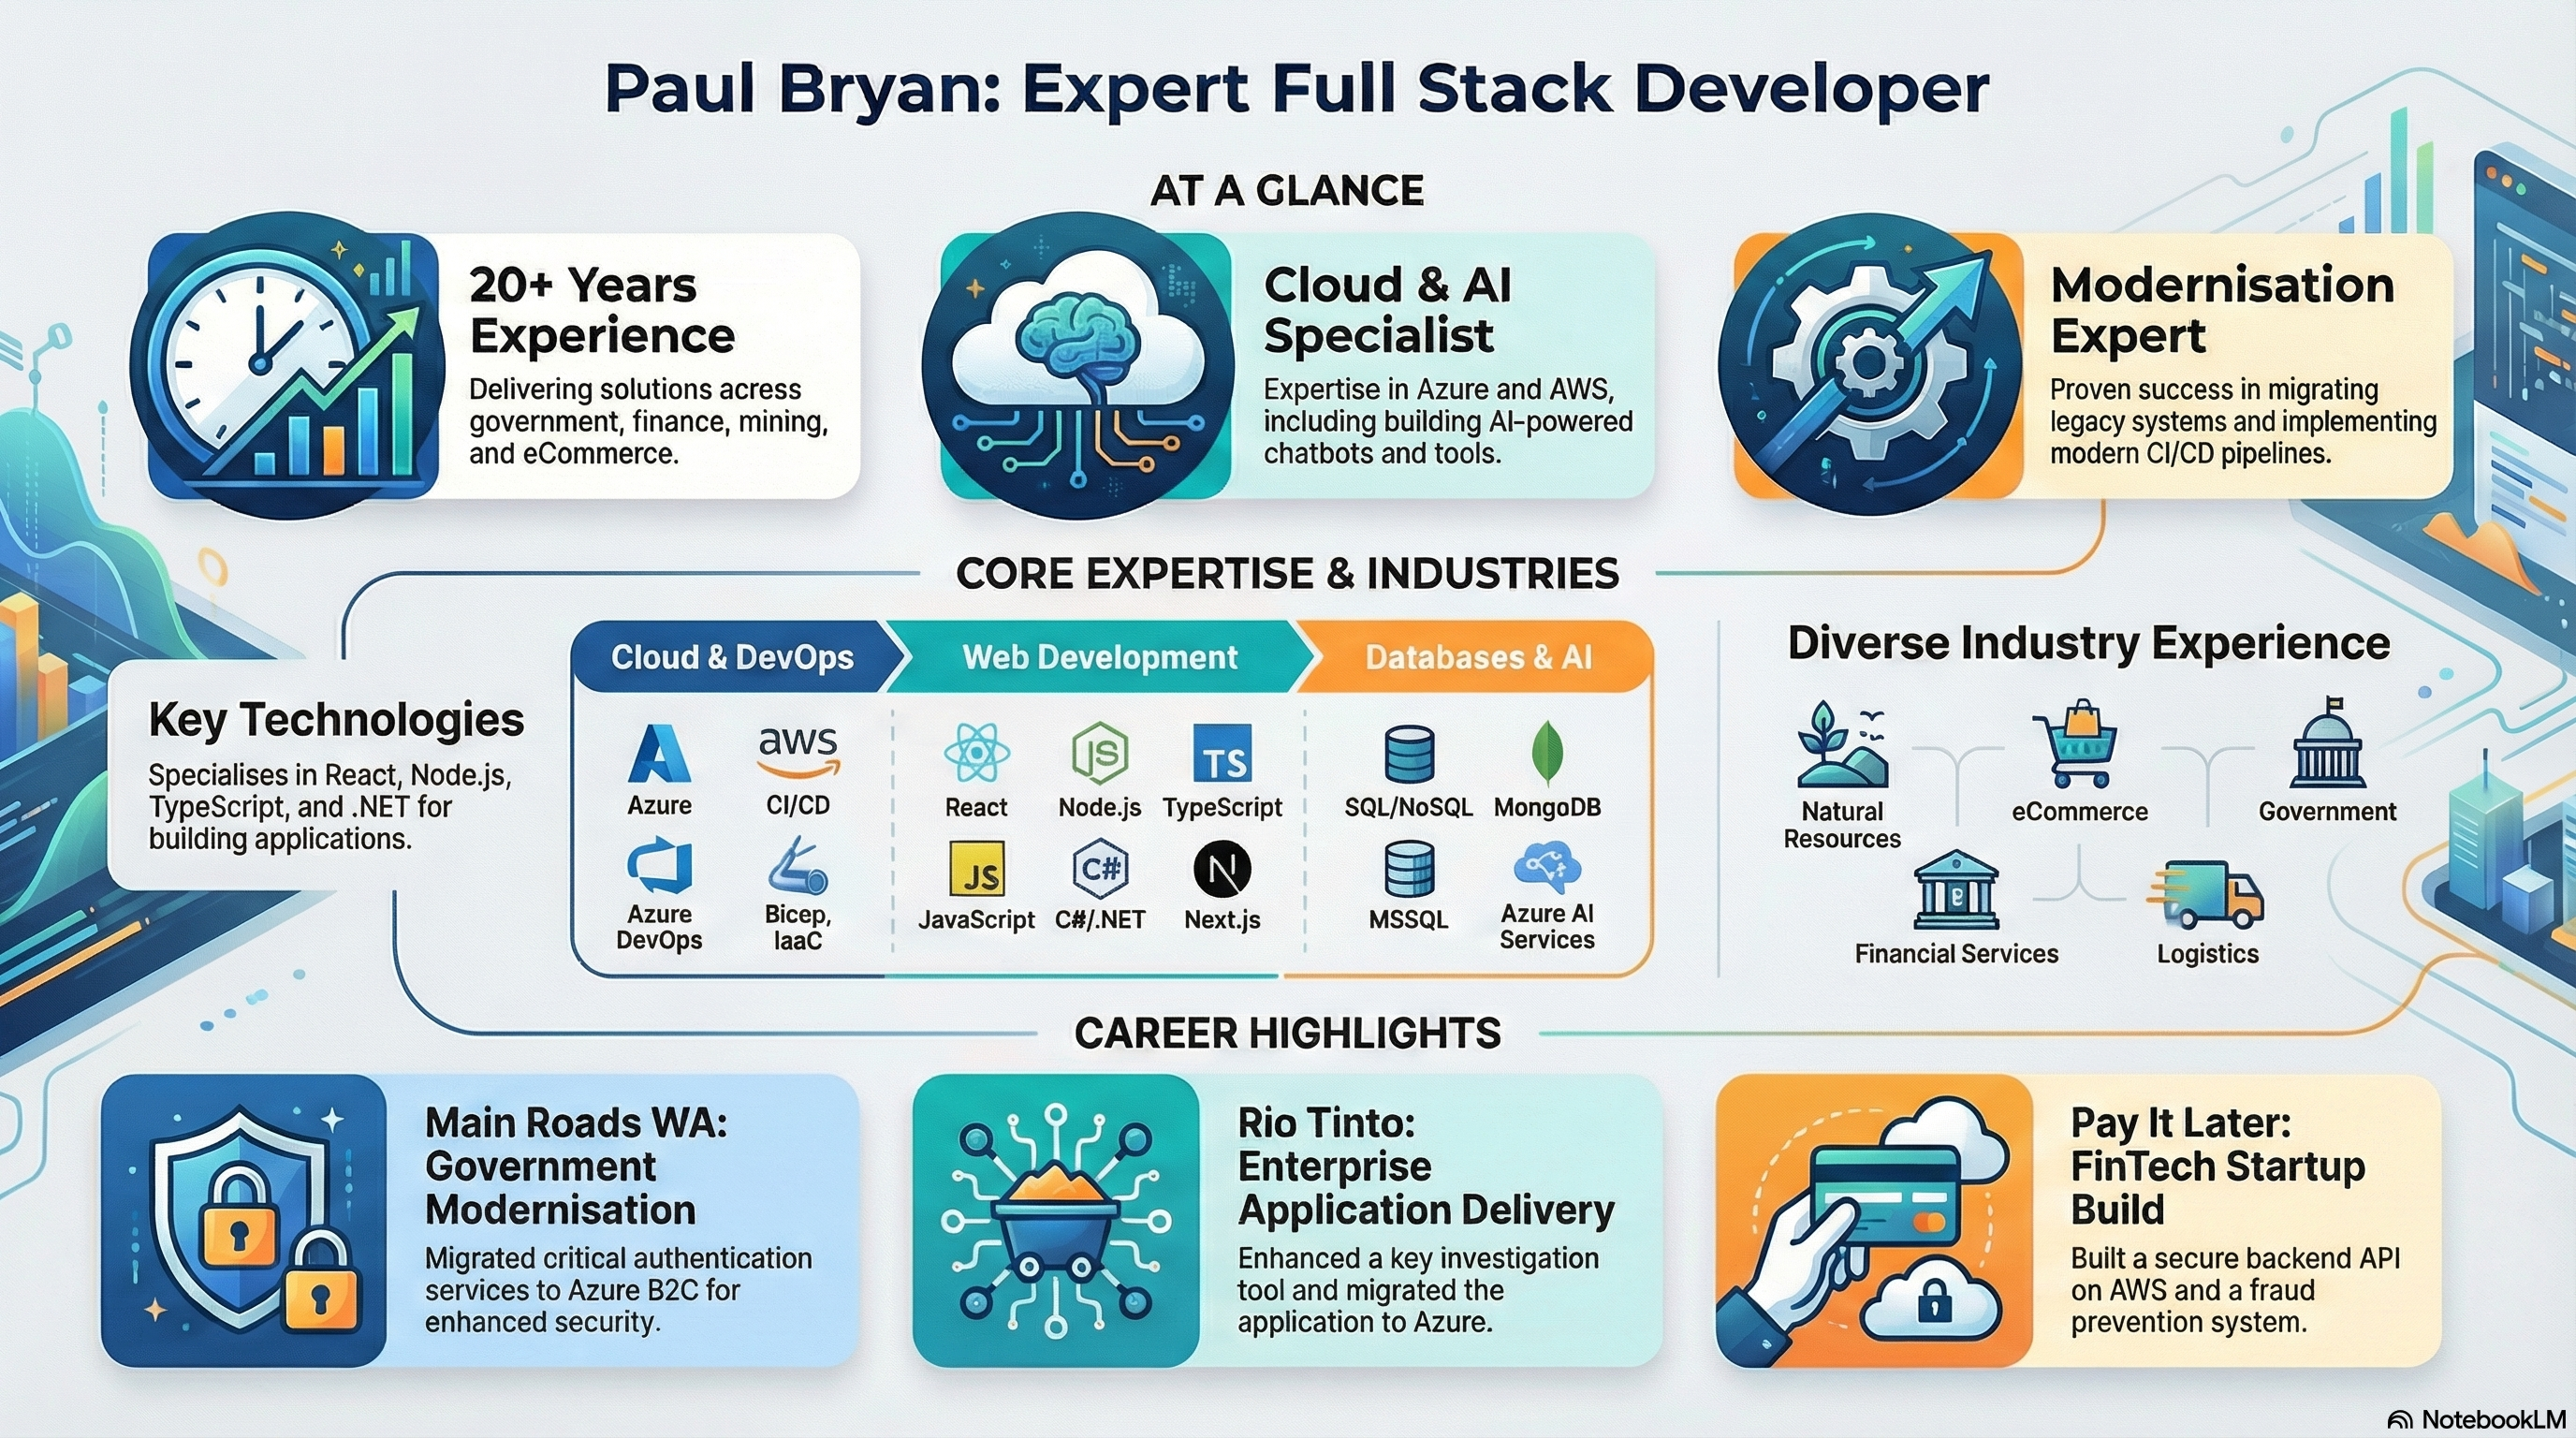
The Infographic Creator: Visual Communication Made Easy
The Studio panel on the right side of NotebookLM's interface now houses the infographic creator, described by many as one of the most mind-blowing features of NanoBanana Pro. Unlike other AI visualization tools that feel like afterthoughts, this is implemented natively with custom prompt engineering specifically for NotebookLM's source-grounded approach.
Why This Matters for Technical Teams
Converting dense technical documentation into visual formats is typically a massive time sink. The infographic creator solves this by:
- Grounding in your sources: All visual content is based on your uploaded documents, reducing hallucinations
- Production-ready output: Quality that rivals dedicated visualization platforms
- Instant iteration: Regenerate with different styles, orientations, or detail levels in seconds
- Creative applications: From architecture diagrams to resume visualizations
Customization Options: The Key to Great Results
The critical pro tip: click the edit button first before generating. Customization makes a huge difference.
Orientation: Choose between landscape, portrait, or square based on your use case (presentations vs. reports vs. social media).
Detail Level: Select concise, standard, or detailed.
- Concise (Simple): Best for accuracy; tends to be "perfectly accurate" even on complex topics.
- Standard: Balanced option for most production content.
- Detailed: "Very aesthetic design" but may contain minor errors on "ultra dense" technical topics.
Style Guidance: A prompt box lets you describe the aesthetic you want—from minimalist corporate to retro cyberpunk.
Practical Use Cases
Technical Documentation:
Upload: API specification documents, architecture diagrams, technical reports
Output: Visual system architecture overview for onboarding
Career Visualization:
Upload: Resume or LinkedIn profile
Output: Custom visual representation of your career journey
Research Synthesis:
Upload: Multiple research papers on a topic
Output: Consolidated visual summary of key findings
Supporting Features: Building Better Context
While the infographic creator is the star, several supporting features enhance the overall workflow and make the visuals more trustworthy.
Deep Research: Autonomous Source Discovery
Before you create infographics, you need quality sources. NotebookLM now includes Deep Research, the same agentic tool available in Gemini. It autonomously researches your topic, analyzes findings, adapts its search strategy to fill gaps, and generates a comprehensive research report.
Crucially, it pulls in all the sources it used directly into your notebook (for example, discovering 52 sources and importing the top 20). This means you get both the research report and a robust, grounded context for creating accurate infographics.
Quality-of-life upgrade: You can now remove all failed sources at once, eliminating the previous tedious process of individual deletion.
Source Validation Prompts
To ensure your sources are high quality and unbiased, use these three validation prompts:
- Conflict Resolution: "Identify any areas my sources disagree on and any contradictions between them." Useful for fact-based research where disagreements need resolution (for example, conflicting API versions).
- Completeness Check: "Identify gaps in my sources. What's missing that would be necessary to understand the topic fully?" Helps surface missing prerequisite knowledge.
- Bias Mitigation: "Are there any contrarian, alternative, or lesser-known viewpoints that are not covered in these sources?" Encourages deeper investigation beyond consensus.
These prompts help you build a more complete view before generating visualizations.
Other Visualization Options
Beyond infographics, NanoBanana Pro powers additional output formats in the Studio panel:
Slide Decks: Choose between a detailed deck (comprehensive text for asynchronous reading) or presenter slides (clean visual talking points). Output quality is consistently high—often "equal to or better than some of the other tools where this is their entire platform."
Video Overview: Creates narrated explainer videos with custom visual styles. Select 'Explainer' or 'Brief' modes, then choose from preset aesthetics or define custom styles (for example, "retro 80s computer interface with neon grids wireframe graphics and cyberpunk aesthetics").
Custom Conversational Goals
You can customize the AI's role and conversational goal using the Custom setting in Configure Notebook options. Set it to act as an encyclopedia, competitor research analyst, architecture coach, or any other persona—ensuring future chats adhere to those preferences and produce more targeted infographics and summaries.
Leverage Persistent Context
NotebookLM now automatically saves chats when you navigate away, preventing loss of valuable research conversations. Better yet, successful troubleshooting chats can be converted into source documents, turning dynamic conversations into queryable reference material for future infographic generation.
Real-World Workflow Example
Here's how a typical technical documentation workflow looks:
- Gather context: Use Deep Research to autonomously discover and import 20+ sources on your topic.
- Validate sources: Run the three validation prompts to identify gaps or biases.
- Remove failures: Batch delete any failed source imports.
- Generate infographic: Click Edit, select Standard detail + landscape orientation, add style guidance.
- Iterate: Regenerate with different styles or detail levels in seconds.
- Export: Use the production-ready infographic in documentation, presentations, or onboarding materials.
Key Takeaways
The infographic creator represents a fundamental shift in how technical teams communicate complex information:
- Trust through grounding: Unlike generic AI visualization tools, all visual content is grounded in your uploaded or agentically discovered sources, dramatically reducing hallucinations.
- Production-ready quality: Output quality consistently equals or surpasses dedicated visualization platforms—without leaving your research environment.
- Customization is critical: Technical users must use the edit button and choose appropriate detail levels (Standard or Concise for dense content) to ensure accuracy.
- Supporting ecosystem: Deep Research, slide decks, video overviews, and custom conversational goals create a complete knowledge-to-visual pipeline.
NotebookLM's evolution from a Q&A tool to a visual content creation platform makes it one of the most powerful and regularly recommended AI tools for software engineers today.
Try it now in NotebookLM: Upload your most confusing internal architectural document and generate a Standard-level infographic. Use it as a quick-reference guide for your team, or create presenter slides for your next sprint review. The results will surprise you.
Other Visualization Options
Beyond infographics, NanoBanana Pro powers additional output formats in the Studio panel:
Slide Decks: Choose between a detailed deck (comprehensive text for asynchronous reading) or presenter slides (clean visual talking points). Output quality is consistently high—often "equal to or better than some of the other tools where this is their entire platform."
Video Overview: Creates narrated explainer videos with custom visual styles. Select 'Explainer' or 'Brief' modes, then choose from preset aesthetics or define custom styles (e.g., "retro 80s computer interface with neon grids wireframe graphics and cyberpunk aesthetics").
Custom Conversational Goals
You can now customize the AI's role and conversational goal using the Custom setting in Configure Notebook options. Set it to act as an encyclopedia, travel planner, competitor research analyst, or any other persona—ensuring future chats adhere to those preferences and produce more targeted infographics.